
📊 Full opportunity report: The Role Of AI In Creating Dynamic Live Warzone Displays on ThorstenMeyerAI.com — validation score, market gap, and execution plan.
TL;DR
A new AI-powered web project visualizes Bitcoin trading activity as a live battlefield, using browser tech to depict market dynamics creatively. It offers an immersive, real-time experience without trading advice.
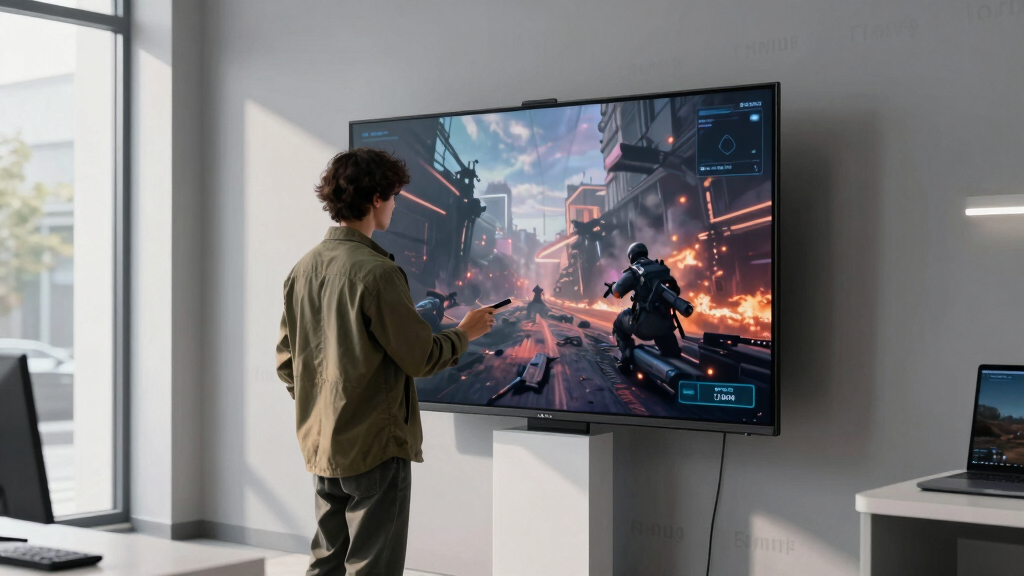
A browser-based visualization project has transformed real-time Bitcoin trading data into a cinematic battlefield scene, powered entirely by AI and advanced web technologies. The project, developed by isbitcoindead.com, is accessible for free and provides an immersive experience that depicts the ongoing tug-of-war between market buyers and sellers. This development highlights how AI and web tech can be harnessed for innovative data visualization, offering a new lens on market activity.
The project, called Bitcoin War, connects directly to public Binance trade streams via WebSocket, with a fallback to Coinbase, ensuring continuous data flow. Every trade is visualized as a combatant—buy orders are represented by forces from the left, sell orders from the right, with large liquidations visualized as airstrikes. The entire scene is rendered client-side using Canvas 2D graphics, WebAudio synthesis, and real-time stream processing, with a minimal footprint of roughly 180KB.
An automatic camera system shifts perspectives between wide views and close-up skirmishes, while a live DEFCON meter indicates market volatility. The visualization includes a scrolling war log narrating ongoing activity and a synthetic soundtrack generated within the browser. Additionally, a comprehensive scoreboard tracks market metrics such as seconds won, casualties, and dollar gains, creating a dynamic narrative of market chaos. Importantly, the project is purely artistic and data-driven; it does not involve trading advice or financial services, with a footer explicitly stating, ‘a live reading of the BTC/USDT tape · no advice, only war.’
Implications of AI-Driven Market Visualizations
This project exemplifies how advanced web technologies and AI can be used to create immersive, artistic representations of financial data. It demonstrates the potential for real-time, browser-based visualizations to enhance understanding of market dynamics, especially for educational or entertainment purposes. While not a trading tool, such visualizations could influence how traders, analysts, and the public perceive market activity, emphasizing the chaotic, warlike nature of trading.
This approach also pushes boundaries in web technology application, showcasing how minimal footprint, client-side processing, and multimedia integration can produce complex, engaging displays without backend infrastructure. As a result, it opens avenues for similar creative projects across finance, gaming, and data visualization sectors.

Software Engineering for Data Scientists: From Notebooks to Scalable Systems
As an affiliate, we earn on qualifying purchases.
As an affiliate, we earn on qualifying purchases.
Evolution of Web-Based Market Visualizations
Traditional market visualizations focus on charts, heatmaps, and dashboards. Recently, developers have explored more artistic, immersive representations, but few have integrated real-time data with cinematic effects. The Bitcoin War project builds on this trend, leveraging browser-native tech to produce a visceral, war-themed depiction of market activity.
Previous efforts have used static or pre-recorded visualizations, but this project demonstrates a move toward live, interactive, and highly stylized displays. It follows a broader trend of using AI and web tech for creative data storytelling, aligning with innovations in gaming, virtual reality, and interactive art.
“This project shows how browser technology can be used to create immersive visualizations that are both artistic and data-driven.”
— an anonymous researcher

ROBOTIME Wooden Grocery Store Playset, Kids Play Store, Starlight Market Kitchen Playset Stand- Realistic Pretend Play Set with Lights, Chalkboard, Gift for Boys Girls 3+
- Farm-Style Green Play Stand: Vibrant green color for farm feel
- Lights for Night Play: Operate stall at night with lights
- Interactive Jingle Bells: Attract customers with bells
As an affiliate, we earn on qualifying purchases.
As an affiliate, we earn on qualifying purchases.
Unanswered Questions About Long-Term Impact
It is not yet clear how such visualizations will influence market behavior or trader decision-making over time. The project is purely artistic and educational; whether similar AI-driven visualizations could be integrated into trading platforms remains unknown. Additionally, the scalability and customization of such tools for different markets or assets are still under development.

Volatility-Based Technical Analysis, Companion Web site: Strategies for Trading the Invisible (Wiley Trading)
As an affiliate, we earn on qualifying purchases.
As an affiliate, we earn on qualifying purchases.
Future Developments in AI-Enhanced Market Visuals
Developers and researchers are expected to explore expanding these visualizations, potentially integrating more AI-driven analytics and user interactivity. Future updates may include multi-asset views, enhanced cinematic effects, or even integration with real trading systems for educational or entertainment purposes. Monitoring user engagement and the impact on market perception will be key in assessing the evolution of this technology.

Mastering Tableau 2026: Implement advanced data visualizations, BI techniques and AI-powered analytics with Tableau
As an affiliate, we earn on qualifying purchases.
As an affiliate, we earn on qualifying purchases.
Key Questions
Is this visualization tool intended for trading decisions?
No, Bitcoin War is purely artistic and educational. It does not provide trading signals or advice.
Can I access this visualization for free?
Yes, it is available at war.isbitcoindead.com and runs instantly in any modern browser.
What technologies does the project use?
It leverages WebSocket streams, Canvas 2D graphics, WebAudio synthesis, and client-side processing, all within about 180KB of code.
Will this influence future market visualization tools?
While primarily artistic, the project demonstrates the potential for immersive, real-time data visualizations that could inspire future tools in finance and education.
Source: ThorstenMeyerAI.com